Textile Products Sector: A Top-Down Probabilistic Outlook for 2026
Analysis by Natan Acosta (Country Manager – Sybilion)

Sybilion is a decision intelligence company focused on helping industrial organisations plan with confidence in uncertain environments. We work with sectors where outcomes are shaped not by a single forecast, but by how leaders interpret risk, timing, and trade-offs across a wide range of possible futures.
Our platform combines probabilistic forecasting with leading macro, trade, credit, and cost signals to translate complex external dynamics into decision-ready insight. Rather than optimising for a single number, Sybilion enables teams to plan against ranges, set clear thresholds, and identify early-warning signals that matter while there is still time to act.
The analysis that follows applies this approach to the textiles and textile products sector. It presents a top-down, probabilistic outlook for 2026, highlights the dominant trends and risks shaping the distribution of outcomes, and outlines how organisations can use these signals to inform inventory, capacity, and commercial decisions under uncertainty.
Summary: 2026 Forecast Report – Textiles & Textile Products (Top-down sector outlook)
Executive takeaways
For 2026, the dominant decision challenge is not contraction versus growth, but how much downside to protect against while preserving upside flexibility.
The 2026 baseline forecast for industrial production in textiles and textile products points to a mild softening through the year rather than a sharp contraction. The median path drifts from roughly 73.0 in January 2026 to about 70.7 by December 2026, a decline of around 3.1% across the year on the index scale. Compared with the most recent observed level (November 2025 ≈ 73.7), the median December 2026 level is about 4.1% lower.
Uncertainty is the more important story. The forecast is probabilistic, and the range of plausible outcomes widens substantially as 2026 progresses. What begins the year with relatively tight dispersion evolves into a much broader set of outcomes by year-end. The 90% range (5th–95th percentile) is about 3.7 index points wide in January 2026 and expands to roughly 11.4 points by December 2026. In practical terms, the “most likely” view is a gradual cooling, but the distribution still allows for either a meaningful downside (mid-60s by year-end) or a modest upside (mid-70s).
For decision-makers, this means the risk is less about getting the point forecast “wrong” and more about being underprepared for divergence in outcomes, particularly in the second half of the year.
What the probabilistic forecast implies
A probabilistic forecast should be read as a fan rather than a single line. For year-end 2026 specifically, the model implies:
- About a 42% chance the index finishes below 70 (December 2026).
- About a 61% chance it finishes below 72.
- About a 21% chance it finishes above 74.
Quarterly view (median and 90% range)
The following summarizes quarterly averages using the median (50th percentile) and the 5th–95th percentiles:
- 2026 Q1: median ~72.8; 90% range ~71.0 to ~75.5
- 2026 Q2: median ~72.0; 90% range ~68.6 to ~75.4
- 2026 Q3: median ~71.7; 90% range ~66.8 to ~76.4
- 2026 Q4: median ~70.9; 90% range ~65.5 to ~76.8
The median outlook cools gradually each quarter, while the downside tail deepens notably in the second half of 2026.
High-level 2026 overview: dominant trends, growth patterns, risks
The central trend is normalization rather than recovery. The median trajectory is consistent with slower end-market pull and a more cautious replenishment cycle, where production broadly flat to slightly declining rather than returning to a clear expansion trend. The forecast does not indicate a strong rebound; instead it suggests demand remains adequate but not strong enough to sustain higher utilization rates.
The growth pattern is best described as “soft patch with widening outcomes.” Early 2026 is relatively anchored, while the back half becomes far more path-dependent. Operationally, this usually presents as increasing dispersion in order books, more volatile lead times, and greater sensitivity to regional demand and competitiveness shifts.
The key risks for 2026 is not a single negative shock, but cumulative slippage: small demand shortfalls, modest cost pressures, or regional imbalances that, taken together, push realised outcomes toward the lower end of the distribution in the back half of the year.
- Demand fragility in discretionary categories. Small changes in retail volumes can propagate quickly into production cuts as inventories adjust, making the sector sensitive to demand disappointments.
- Trade- and FX-driven competitiveness shifts. Effective exchange rate moves can alter sourcing decisions and export competitiveness, particularlry where customers can substitute suppliers across regions with limited switching friction.
- Cost-side volatility (energy and labor). Even if demand softens only mildly in the median view, margin pressure can force production rationalization if costs rise faster than selling prices.
- Second-half uncertainty. The widening fan indicates macro, trade, and policy conditions matter more as 2026 progresses. Confidence is highest near-term, with planning increasingly scenario-based after mid-2026.
Key business drivers and what to monitor
The model identifies a set of macro, trade, labor, and energy-related drivers that tend to historically lead textiles production by several months. These are not short-term predictors, but early-warning signals that help decision-makers assess whether risks are building, stabilising, or easing. The lag windows are important: they provide early-warning value for planning. In practice, this means movements in these indicators tend to appear well before changes are visible in realised production data, giving organisations time to adjust inventory targets, capacity utilisation, sourcing commitments, and pricing strategies. The value lies not in precise timing, but in providing advance notice that risks are shifting, allowing decisions to be stress-tested against a range of outcomes rather than made reactively once production has already adjusted.
- Effective Exchange Rate (EER) – CAD – Real effective exchange rate (lag 4–24 months; impact 100)
Why it matters: Effective exchange rates are a proxy for shifting cost competitiveness and import pressure. A strengthening currency tends to increase competitive pressure from imports and can weigh on domestic production; a weakening currency often supports local production and exports.
What to monitor: the direction and persistence of moves (3–6 month trend), not a single monthly print. Use this as a competitiveness and sourcing-pressure flag. - European Union: Turnover and volume of sales in wholesale and retail trade (lag 4–22 months; impact 100)
Why it matters: This is a demand proxy. When turnover/volume improves, downstream replenishment tends to lift production with a lag; when it softens, production cuts often follow as inventories are worked down.
What to monitor: emphasize the volume component (real activity) versus nominal turnover. This can be translated into a “demand climate” adjustment in planning. - African imports of apparel (not knitted/crocheted) from China, FOB value (lag 4–22 months; impact 100)
Why it matters: A trade-flow signal reflecting end-demand conditions and supply chain throughput. It also captures dynamics in China-linked sourcing channels.
What to monitor: trend and inflection points (accelerating vs decelerating). Sharp slowdowns are a caution flag for broader apparel/textile demand. - Commodity Terms of Trade (CTOT) – Turkey – Commodity Export Price Index (lag 7–24 months; impact 100)
Why it matters: Turkey is a key node in textiles/apparel. Shifts in relative commodity pricing and trade conditions can influence costs, competitiveness, and regional sourcing decisions.
What to monitor: sustained moves rather than monthly volatility; incorporated into supplier and procurement risk review. - All Employees: Manufacturing in America (lag 7–23 months; impact ~99.3)
Why it matters: A broad-cycle indicator. Employment tends to weaken when the industrial cycle turns down and strengthens when capacity utilization rises.
What to monitor: momentum (3-month change) and breadth across manufacturing. Treat it as confirmation of whether production risk is rising. - All Employees: Government, USA (lag 7–24 months; impact ~96.3)
Why it matters: A proxy for macro stability via public-sector employment and income conditions, which can influence aggregate demand and confidence.
What to monitor: trend breaks rather than noise; treat as a secondary macro-stability signal. - Labour input in industry – Wages and salaries, Manufacture of leather and related products, Scandinavia (lag 10–24 months; impact ~89.2)
Why it matters: A cost-pressure proxy in adjacent categories and a signal for wage dynamics in industrial segments.
What to monitor: acceleration in labor costs. If costs rise while demand is softening, margin compression risk increases. - Inter-country trade within EU of liquefied petroleum gases (lag 4–15 months; impact ~74.1)
Why it matters: An energy conditions proxy relevant to industrial cost bases and operating decisions.
What to monitor: directional shifts and sustained tightness; pair with internal energy cost exposure where possible. - Renewable electricity generation share (hydro, bio-energy, other renewables), North America (lag 11–24 months; impact ~49.2)
Why it matters: A medium-term energy-structure proxy, often associated with energy price stability and cost base shifts.
What to monitor: longer-run direction; best used for scenario framing rather than short-term triggers. - Fresh chilled or frozen muscle cuts of beef: accumulated exports – LATAM (lag 4–24 months; impact 100)
Why it matters: Functions primarily as a broader trade-cycle proxy rather than a direct textiles mechanism, capturing logistics and commercial activity momentum.
What to monitor: trend and turns; use as corroboration when other demand/trade indicators shift.
What to monitor most closely (practical shortlist)
For a concise monthly dashboard, prioritize:
- EU wholesale/retail volume and turnover (demand pulse; medium lead time)
- Effective exchange rates (competitiveness/sourcing pressure; broad lead time)
- Apparel import flows from China into Africa (trade and demand proxy)
- US manufacturing employment (industrial-cycle confirmation)
- One energy proxy (EU LPG trade) as a cost-risk overlay
How organizations can use this outlook in planning
With a mildly negative median outlook and large uncertainty, the optimal posture is “base case efficiency, downside readiness, upside optionality.”
Recommended stance:
- Inventory: modestly tighten targets in the base case, with explicit downside triggers to accelerate destocking if demand indicators deteriorate.
- S&OP: move from single-number forecasts to range-based planning. Use the probabilistic bands to size safety stocks, capacity buffers, and procurement flexibility.
- Capacity and labor: avoid irreversible expansions; favor flexible staffing, maintenance timing, and shift optimization. The widening second-half uncertainty supports keeping optionality.
- Procurement and pricing: monitor FX and energy proxies to time contract renewals, manage exposure, and revisit pricing corridors with customers as conditions shift.
Simple early-warning trigger framework
- Demand warning: sustained deterioration across multiple releases in EU retail/wholesale volumes and trade-flow proxies → bias planning toward the lower half of the forecast range.
- Competitiveness warning:a sustained and economically significant FX appreciation → anticipate higher import pressure and prioritize margin-defense actions.
- Cost warning: tightening energy conditions plus wage acceleration → prioritize productivity, mix optimization, and price discipline even if volumes remain stable.
Method note
This is a probabilistic, model-based forecast of sector production volume using the NAICS textiles and textile products industrial production index as a top-down indicator. It captures historical relationships between production and leading macro/trade drivers. Unexpected shocks (for example sudden geopolitical escalations) are not directly predictable, but the economic conditions that typically precede or accompany regime shifts can be reflected if they appear in leading indicators.
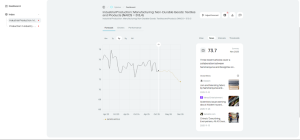
Forecast showing the market movement with slider that shows that month’s News:
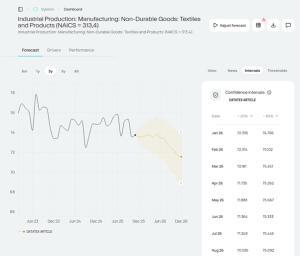
Our actual probabilistic forecast (with 60% confidence intervals) interchangeable by clients to fit their need:
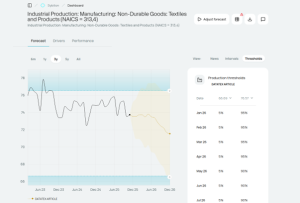
Use thresholds to highlight key levels in your forecast—risk, break-even, and upside targets. Customize them anytime: